The worldwide NFT market is transforming on an unprecedented scale, having been estimated at $43.08 billion in 2025 and a forecasted $60.82 billion in 2026. Ethereum dominates 62% of NFT contracts while gaming NFTs represent 38% of transaction volume, a strong signal of sector adoption.
This article explores market size, top sales, user demographics, and key trends shaping 2026.
NFT Market Size: Top Picks
- The global NFT market is projected to reach $60.82 billion by 2026.
- NFT market cap is estimated at $5.6 billion in 2026.
- Total NFT sales volume reached $2.8 billion in H1 2026.
- “The Merge” sold for $91.8 million, making it the most expensive NFT.
- Ethereum holds 62% of NFT contracts, leading the blockchain.
- Gaming NFTs capture 38% of total transaction volume in 2026.
- Asia has 2.8 million NFT owners, the largest global region.
- India shows the highest adoption: 13.5% NFT ownership rate.
What Is The Current NFT Market Size?
- In 2025, the global NFT industry was valued at $43.08 billion, and it is projected to expand to $60.82 billion in 2026, growing at a CAGR of 41.2%.
- If this trajectory holds, the market could reach an astonishing $245.42 billion by 2029.
Source: The Business Research Company
- Yet, market capitalization tells a slightly different story. The NFT market cap is estimated at $5.6 billion, with a 4.31% daily change and about $13 million in daily trading volume.
Source: Coingecko
This gap between the industry’s projected market size and its real-time market cap highlights a central theme in NFTs: massive long-term potential paired with short-term volatility.
- From a sales perspective, NFT activity remains significant. In the first half of 2025, total NFT sales volume reached $2.8 billion.
Source: CryptoSlam
While this number is lower than the peak frenzy of 2021–2022, it underscores that NFTs are not dead. The market is consolidating, maturing, and shifting toward sustainable growth.
Which Is The Most Expensive NFT Ever?
- “The Merge” by Pak holds the record as the most expensive NFT price ever sold, reaching $91.8 million on December 2, 2021, and currently, it holds a total volume of $100 million.
Source: NiftyGateway
In March 2021, Beeple’s digital collage “Everydays: The First 5000 Days” sold for $69.3 million at Christie’s, marking the first time a major auction house sold a purely digital NFT and propelling the NFT market into the mainstream.
The artwork, a compilation of 5,000 images created over 13 years, captured Beeple’s evolution as an artist and global cultural moments.
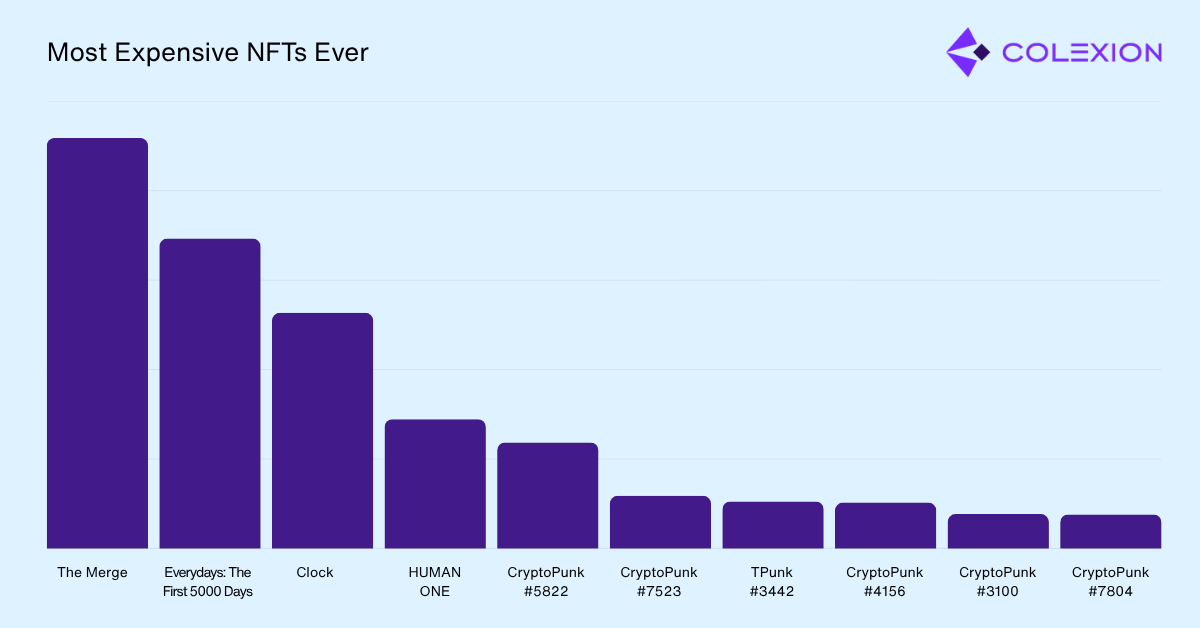
Here are the top 10 most expensive NFTs ever sold:
| Rank | NFT Name | Price | Date Sold |
|---|---|---|---|
| 1 | The Merge | $91.8 million | December 2021 |
| 2 | Everydays: The First 5000 Days | $69.3 million | March 2021 |
| 3 | Clock | $52.7 million | February 2022 |
| 4 | HUMAN ONE | $28.9 million | November 2021 |
| 5 | CryptoPunk #5822 | $23.7 million | February 2022 |
| 6 | CryptoPunk #7523 | $11.75 million | June 2021 |
| 7 | TPunk #3442 | $10.5 Million | August 2021 |
| 8 | CryptoPunk #4156 | $10.26 million | December 2021 |
| 9 | CryptoPunk #3100 | $7.67 million | March 2021 |
| 10 | CryptoPunk #7804 | $7.6 million | March 2021 |
Source: Webopedia
Top NFT Blockchains
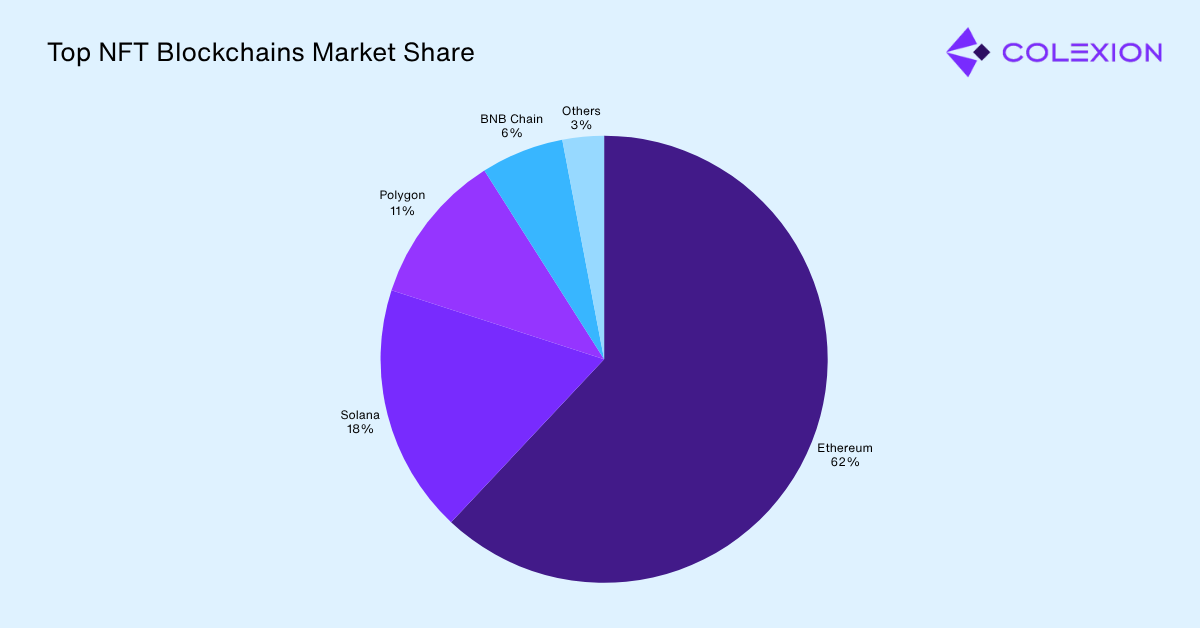
- Ethereum continues to lead the NFT sector with around 62% of NFT contracts, thereby presenting itself as the largest trading portal.
In 2025, Solana will facilitate around 18% of NFT transactions due to its speed and cheap transaction costs.
Along with Starbucks and Nike, Polygon hosts another 11% of total NFT minting activities.
In the DeFi-NFT hybrid world, BNB Chain is powerfully vying to be the most prominent player, taking around 6% of the NFT market share in 2025.
| Sr. No. | Blockchain | Market Share (2025) |
|---|---|---|
| 1 | Ethereum | 62% |
| 2 | Solana | 18% |
| 3 | Polygon | 11% |
| 4 | BNB Chain | 6% |
| 5 | Others | 3% |
Source: Coinlaw
NFT User Demographics
- Asia has the largest number of NFT owners at 2.8 million, representing 0.06% of the population.
- For every nine male NFT owners, there are five female owners.
- The United States shows 3.8% male ownership and 1.3% female ownership, making the total ownership share 5.1%.
Source: ElectoIQ
NFT User Demographics By Gender
- Male NFT owners account for 63% of total ownership.
Female NFT owners comprise 35% of the total NFT ownership demographic.
2% of NFT owners prefer not to reveal their gender.
| Sr. No. | Gender | % of NFT Owners |
|---|---|---|
| 1 | Male | 63% |
| 2 | Female | 35% |
| 3 | Prefer not to say | 2% |
Source: ElectoIQ
NFT User Demographics By Age
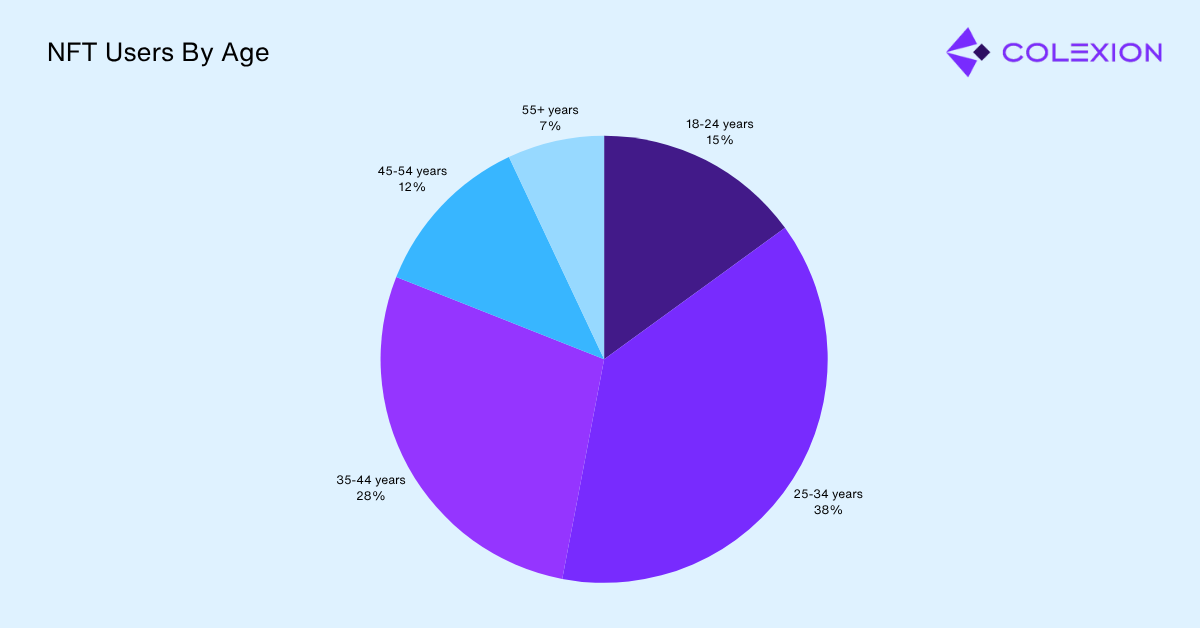
- People aged 25 to 34 make up 38% of everyone who owns an NFT.
Adults aged 35 to 44 years represent 28% of NFT ownership demographics.
Individuals aged 18 to 24 years account for 15% of NFT owners.
People aged 45 to 54 years comprise 12% of NFT ownership.
Adults aged 55+ years make up only 7% of NFT owners.
| Sr. No. | Age Group | Percentage of NFT Owners |
|---|---|---|
| 1 | 18-24 years | 15% |
| 2 | 25-34 years | 38% |
| 3 | 35-44 years | 28% |
| 4 | 45-54 years | 12% |
| 5 | 55+ years | 7% |
Source: ElectoIQ
- In the United States, 5% of adults aged 18-34 own NFTs, while ownership drops to just 1% for people over 55.
Source: Finder
NFT User Demographics By Country
- India leads global NFT adoption with 8.4% male ownership and 5.1% female ownership, combining to a 15.5% adoption rate, the highest globally.
Nigeria ranks second with 5.6% male ownership and 3.0% female ownership.
| Country | Male | Female | Total |
|---|---|---|---|
| India | 8.4% | 5% | 13.5% |
| Nigeria | 5.6% | 3% | 8.6% |
| USA | 3.8% | 1% | 5.1% |
| Canada | 1.9% | 1% | 3.0% |
| Philippines | 5.0% | 2% | 7.4% |
| Vietnam | 6.4% | 5.2% | 11.6% |
| Indonesia | 4.9% | 2.9% | 7.8% |
| Singapore | 5.6% | 3.6% | 9.2% |
| Ghana | 4.7% | 2.8% | 7.5% |
| Venezuela | 3.2% | 2.2% | 5.4% |
| Ireland | 3.6% | 1.7% | 5.3% |
| Argentina | 3.1% | 1.4% | 4.5% |
| Australia | 3% | 1.4% | 4% |
| Germany | 1.6% | 0.7% | 2.3% |
| Malaysia | 3.8% | 2.2% | 6.0% |
| Japan | 1.5% | 1.6% | 3.1% |
| Sweden | 2.4% | 0.8% | 3.2% |
| Colombia | 2.8% | 2% | 4.8% |
| Norway | 2.5% | 1% | 3.5% |
| New Zealand | 2.1% | 1.1% | 3.2% |
| South Africa | 2.7% | 1.3% | 4.0% |
| Hong Kong | 6.10% | 4.7% | 10.8% |
| Brazil | 4.6% | 3.5% | 8.1% |
| Mexico | 2.3% | 2% | 4.3% |
| Kenya | 4.1% | 2.8% | 6.9% |
| United Kingdom | 2.2% | 0.9% | 3.1% |
Source: ElectoIQ
Also Read:
NFT Market Trends
- Gaming NFTs command a bulk of market activity with 38% of the total transaction volume in 2026, owing to play-to-earn and genuine ownership models.
- AI-powered NFTs will account for 30% of all project developments in 2026, thus mixing blockchain provenance and the notion of evolution and adaptation of digital assets.
- Real estate NFTs experienced a year-over-year growth of 32%, pushed by virtual lands and tokenized deeds for properties, bringing the market size to $1.4 billion.
- Fashion NFTs, powered by digital wearables and luxury brand teams, made it to a $890 million valuation
- Music NFTs grossed revenues of over $520 million via streaming tokens and artists’ royalties.
- Phygital NFTs saw 60% transaction volume growth, connecting physical goods with digital tokens, particularly in luxury markets.
- Carbon credits NFTs reached $300 million in transactions, linking sustainability initiatives with blockchain utility.
- Event ticketing NFTs capture 5.3% of ticket sales across major US venues, providing fraud prevention and resale control.
- Identity NFTs reached 12 million issued in 2026, supporting decentralized IDs and membership systems.
Source: Coinlaw
